
1.3. Discuss the use of epidemiology to explain the health status of Australians
EXPLORE THIS MODULE
RELATED RESOURCES

FREE: A Guide to Verb + Marks: EXPLAIN
Unpack ‘explain’ questions, it’s marking criteria and write stronger responses.

PDHPE to HMS Dashboard
Mapped practice questions, marking support and student activities.

A Guide to Verbs + Marks
Teach your students to understand exactly how to write their way into the top band for HMS
GET FREE HMS RESOURCES AND UPDATES
Receive new resources, examination support and teaching ideas straight to your inbox.
About the dot point
Australians’ health status can be explained using epidemiology because it uses population data to show patterns and causes of health and disease. This dot point focuses on how measures such as mortality, infant mortality, morbidity, incidence and prevalence are used in health reports to describe what health looks like in Australia, how it changes over time, and how it differs between groups.
How to approach it
The directive verb in this dot point is discuss. This means you need to identify the key issues and present more than one relevant point by considering strengths and limitations, or points for and against. In this topic, that involves using evidence from tables and graphs to explain what the epidemiological measures show about Australians’ health status, while also acknowledging what these measures can and cannot show.
1. Epidemiology

Epidemiology is the study of health and disease in populations. It looks for patterns and causes of illness, injury, and death, and it measures how often these events happen. Reports often compare groups by age, sex, location, or socioeconomic status.
Epidemiologists use data from hospitals, health services, surveillance systems, population surveys, and the register of births and deaths. This helps describe Australia’s health status using clear measures.
A strength of epidemiology is that it turns health into evidence you can compare across time and groups. This helps with priorities, prevention, and how health resources are shared. A limitation is that it often measures ill health more easily than positive health, so some parts of health (like daily functioning and wellbeing) can be missed or underrepresented.
Example: If a report shows the incidence of melanoma is rising in young adults in NSW, this suggests risk is increasing and can support stronger prevention (for example, targeted UV education and more shade in school sport settings). If mortality from melanoma is falling at the same time, this can suggest earlier detection and better treatment are working.
1.1. Mortality
Mortality means the number or rate of deaths in a population over a set time. It is often shown as a rate (for example, deaths per 100,000 people) so comparisons are fairer.
Mortality data helps explain health status by showing whether Australians are dying less often, dying later in life, or dying from different causes over time.
In Australia, many of the leading causes of death are non-communicable diseases. These often include coronary heart disease and dementia (including Alzheimer’s disease). Mortality data can also show major events. For example, during the pandemic period, COVID-19 changed patterns of death in Australia.
A key concept in mortality data is the age-standardised mortality rate. This uses age-standardisation to adjust for different age structures between populations. This matters because an older population will usually have more deaths, even if overall health is similar.
Another mortality indicator is life expectancy, which summarises death rates into an estimate of how long people are expected to live if current rates continue. Australia’s life expectancy at birth is high, which generally reflects low overall mortality.
Example: If two states have the same number of deaths, but one has an older population, the crude death count can be misleading. The age-standardised mortality rate helps you compare health status more fairly by reducing the impact of age differences.
1.2 Infant mortality
Infant mortality is the number of deaths of babies aged under one year per 1,000 live births. It is often used because it can reflect maternal health, the quality and access to antenatal and postnatal care, and broader living conditions.
Australia’s infant mortality rate is low by global standards. Long-term declines link to improvements in sanitation, nutrition, immunisation, pregnancy care, and newborn medical care. However, averages can hide differences between groups and places, so infant mortality can also highlight inequities within Australia.
Example: A low national infant mortality rate can suggest strong maternity and newborn care overall. If a report then shows higher infant mortality in very remote regions, it can point to an inequity in access to services and specialist care.
1.3 Morbidity

Morbidity means illness, injury, and disability in a population. Unlike mortality, it includes health problems that may not cause death but can reduce daily functioning and quality of life.
Morbidity is often explained using incidence and prevalence. It is also described using data from:
- health surveys (which may rely on self-report)
- hospitalisation and emergency care data (which can miss conditions managed outside hospital)
- health service use data
- disability and functional limitation measures
Australian morbidity data shows that many people live with long-term conditions. This helps explain health status by showing that even with high life expectancy, many Australians need ongoing management and support for health conditions.
Example: If mortality from heart disease falls but morbidity from cardiovascular disease rises, it can mean more people are surviving and living longer with the condition. This can increase demand for rehab and long-term care.
1.4 Incidence
Incidence is the number of new cases of a condition in a population over a set time (often each year). It helps show emerging problems, changing risk, and the impact of prevention.
Incidence can rise because risk is rising, because detection is better, or both. This is why incidence is important when you are explaining changes in health status over time.
Example: If a screening program expands, incidence can rise at first because more cases are found earlier. If the program works well, later reports may show reduced mortality.
1.5 Prevalence
Prevalence is the total number or proportion of people who have a condition at a given time. It helps estimate how widespread a condition is and the likely ongoing demand for healthcare and support services.
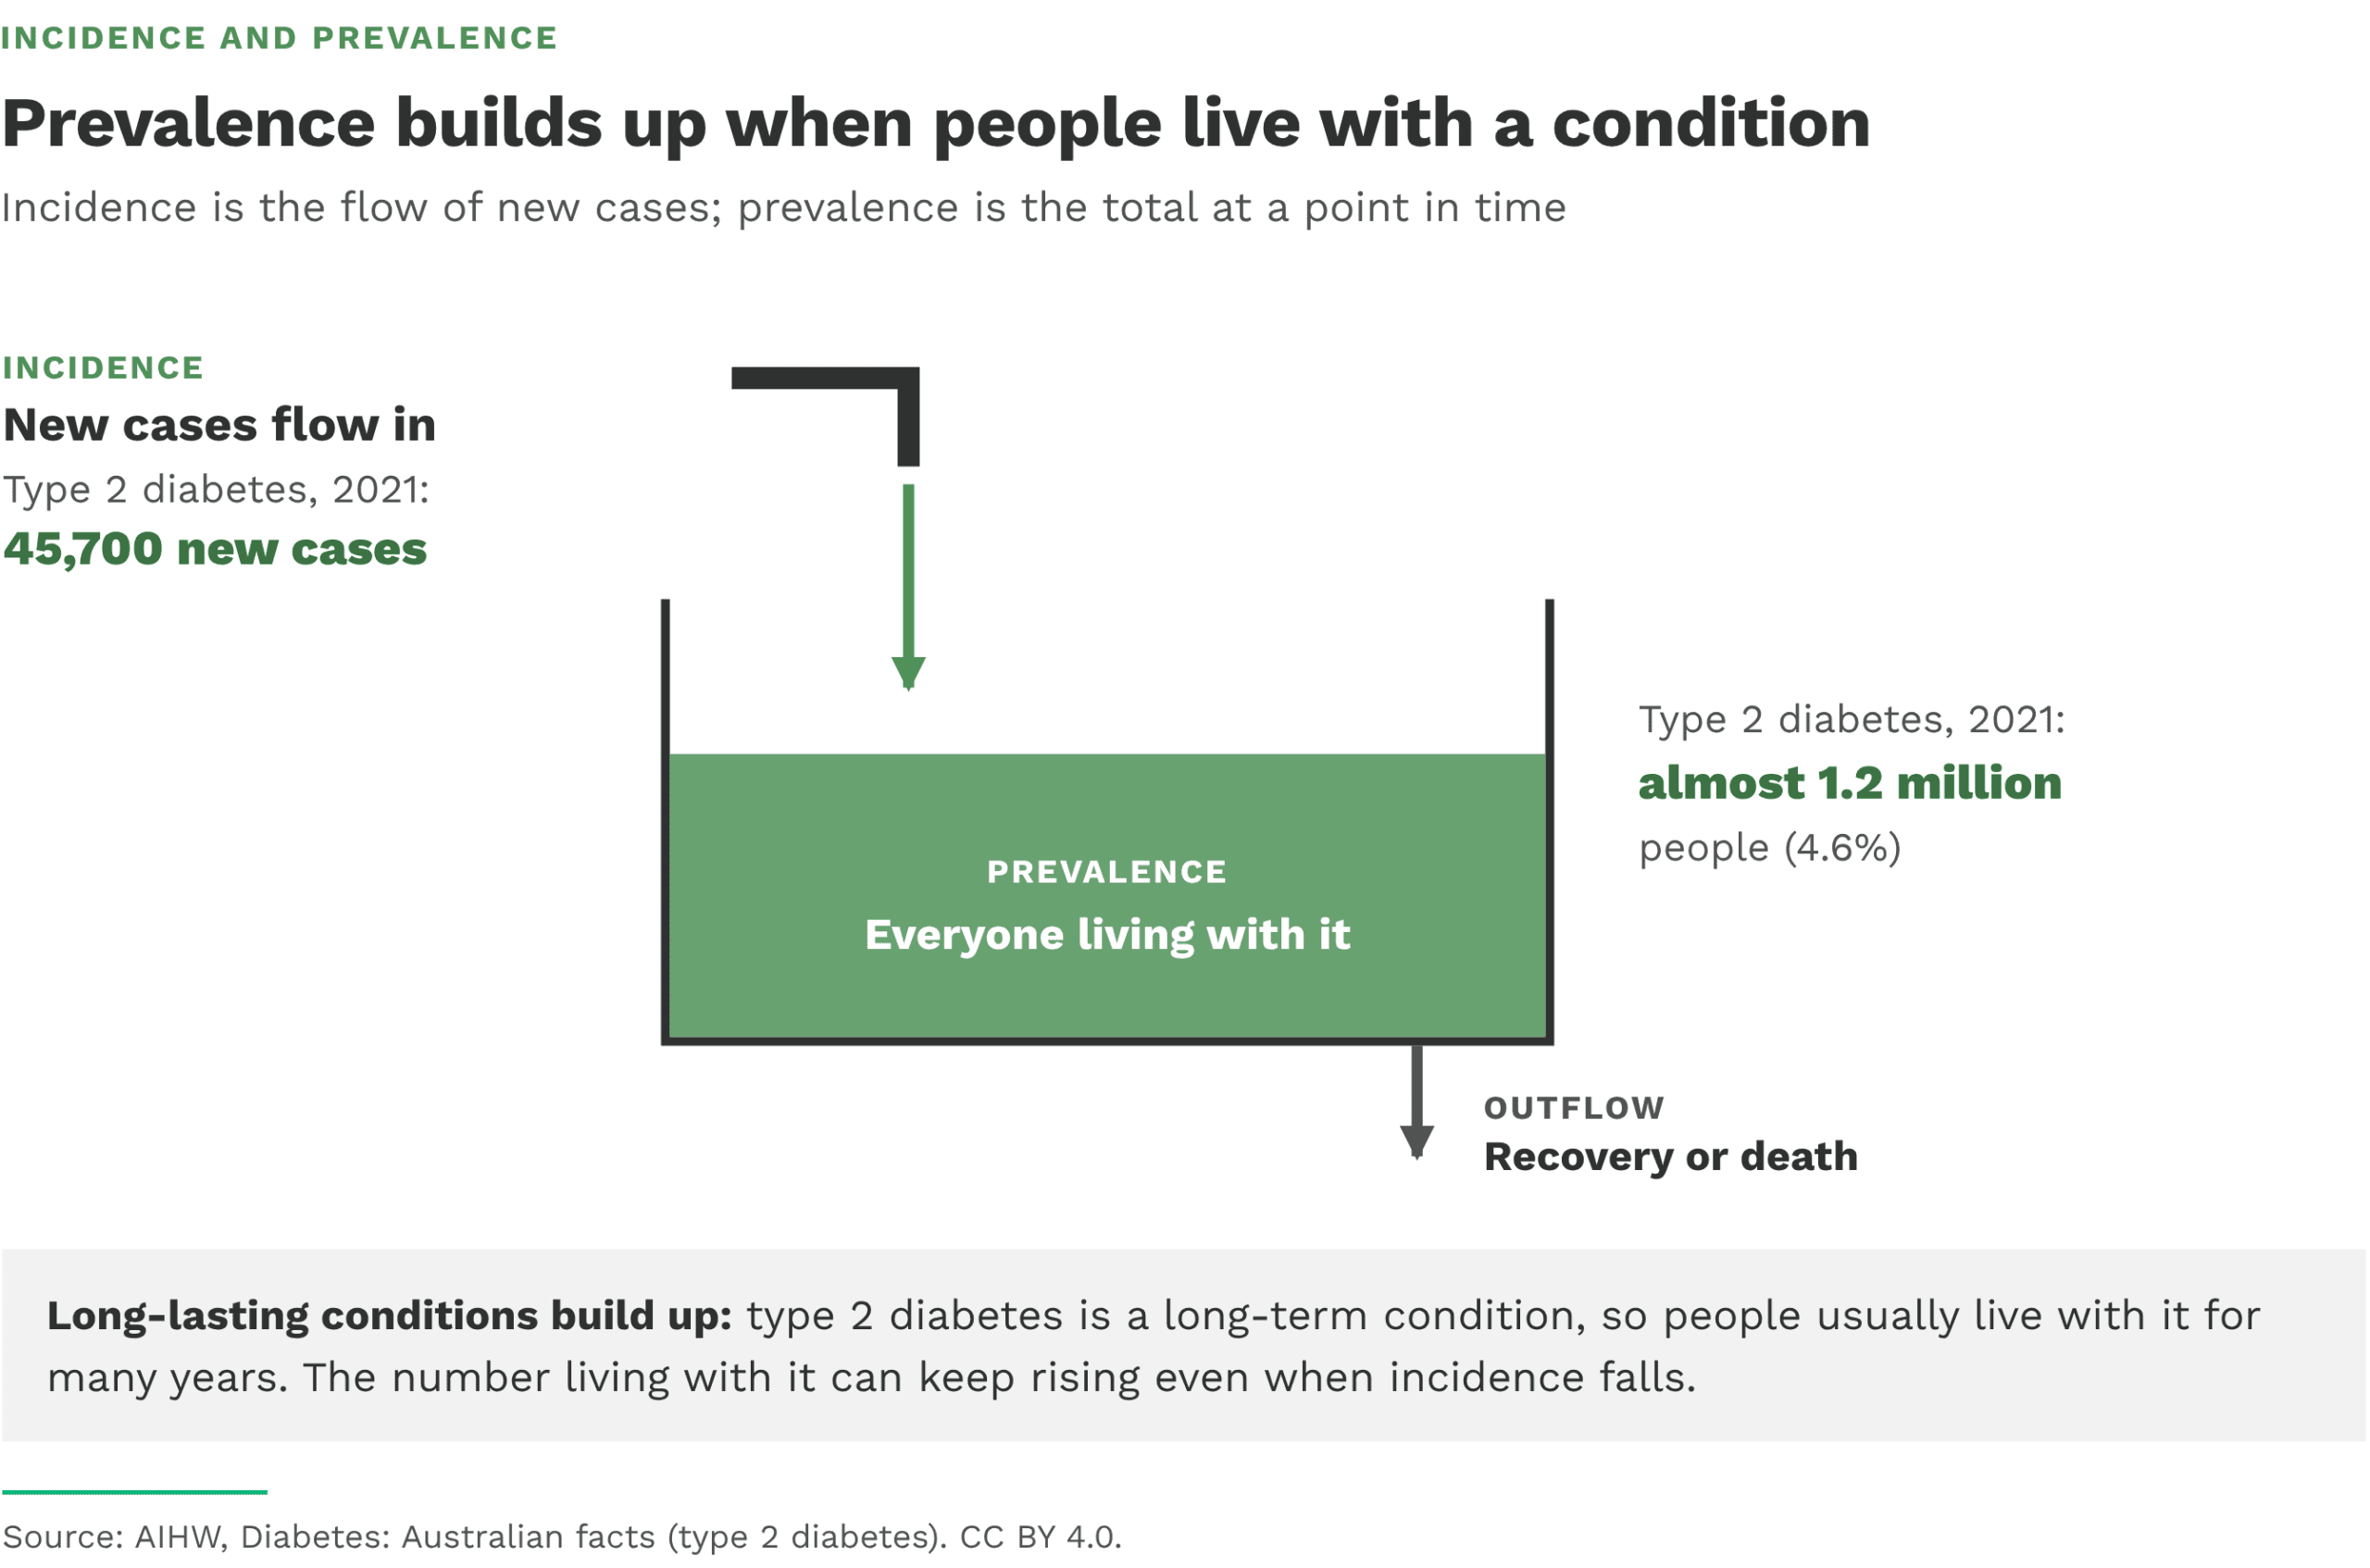
Prevalence is influenced by how many new cases occur (incidence) and how long people live with the condition (duration and survival).
Example: A condition can have low incidence but high prevalence if people live with it for many years. This matters for planning long-term services.
1.6 Incidence and prevalence together
Incidence and prevalence work best when used together:
- Incidence shows how quickly new cases are occurring.
- Prevalence shows how many people are living with the condition overall.
Prevalence can rise even if incidence stays steady, if people are living longer with the condition due to better treatment. Prevalence can stay low even with high incidence if the condition resolves quickly.
2. Using tables and graphs to explain health status
Tables and graphs in health reports are designed to show patterns that support explanation and comparison. To interpret them, you need to be clear about what is being measured and how the comparison is made.
Health reports usually tell you:
- the measure (mortality, morbidity, incidence, prevalence, life expectancy)
- the unit (counts, percentages, rates per 1,000 or per 100,000)
- the population (for example, all Australians or groups by age, sex, or location)
- whether the results are un-adjusted or age-standardised
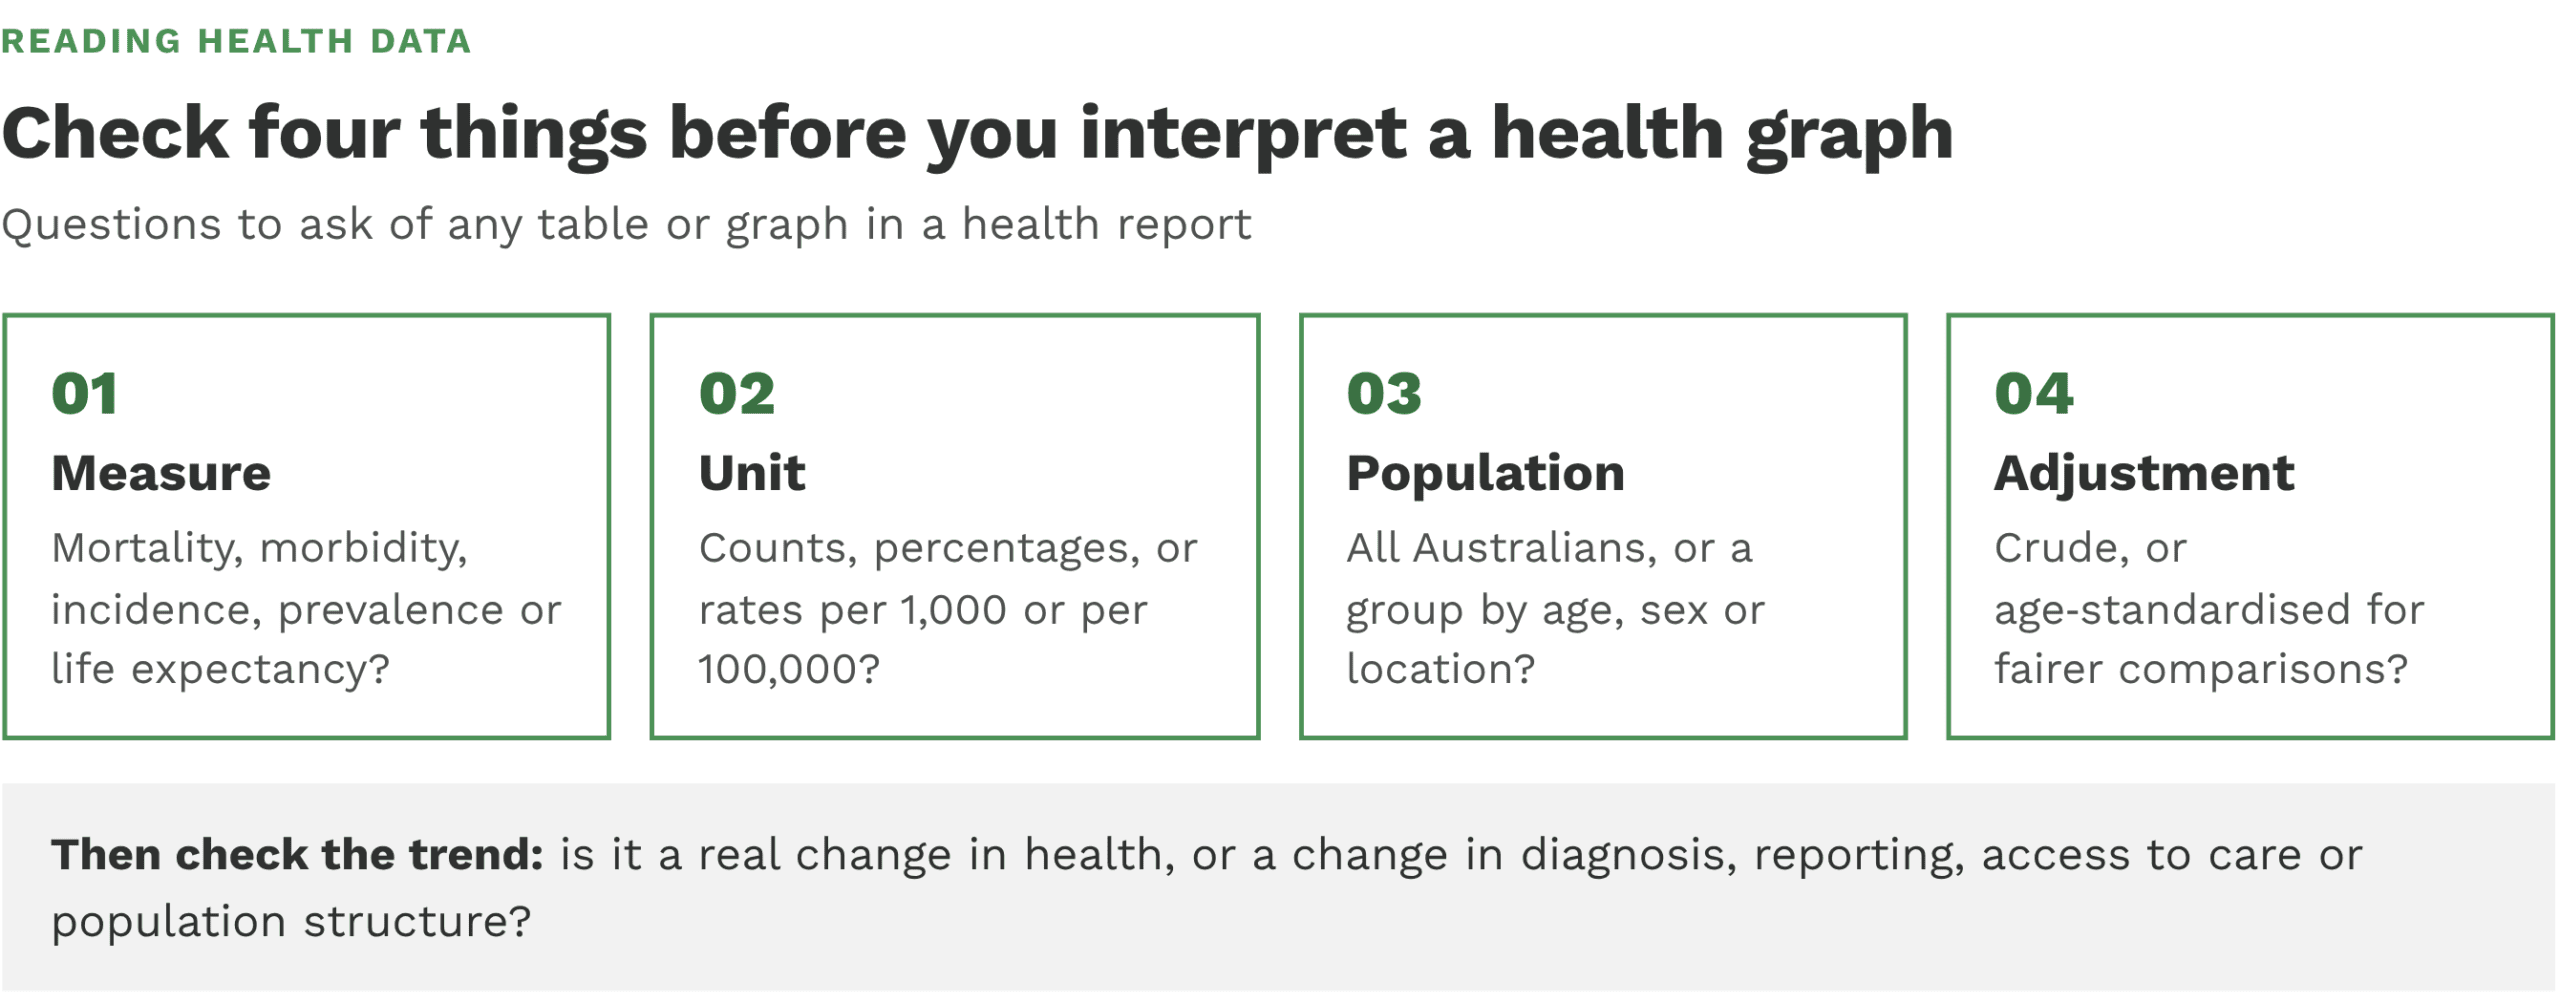
Trends over time can reflect real changes in health, but they can also reflect changes in diagnosis, reporting, access to care, or population structure. Sudden spikes and drops need careful interpretation, especially during major events like a pandemic year.
Data notes also matter. For example, under-diagnosis can lower reported incidence and prevalence, and provisional cause-of-death data can change later after investigations are finalised.
2.1 Mortality – leading causes of death (2025)
This bar chart compares the five leading causes of death for males and females in 2025. Coronary heart disease (ischaemic heart disease) remains the leading cause of death for males (10,263 deaths), while dementia, including Alzheimer’s disease, is the leading cause for females (11,628 deaths). Lung cancer, cerebrovascular disease and chronic lower respiratory diseases (such as COPD) also feature for both sexes. The data shows the ongoing dominance of chronic diseases in Australian mortality patterns, and sex-specific differences that matter for targeted health strategies.
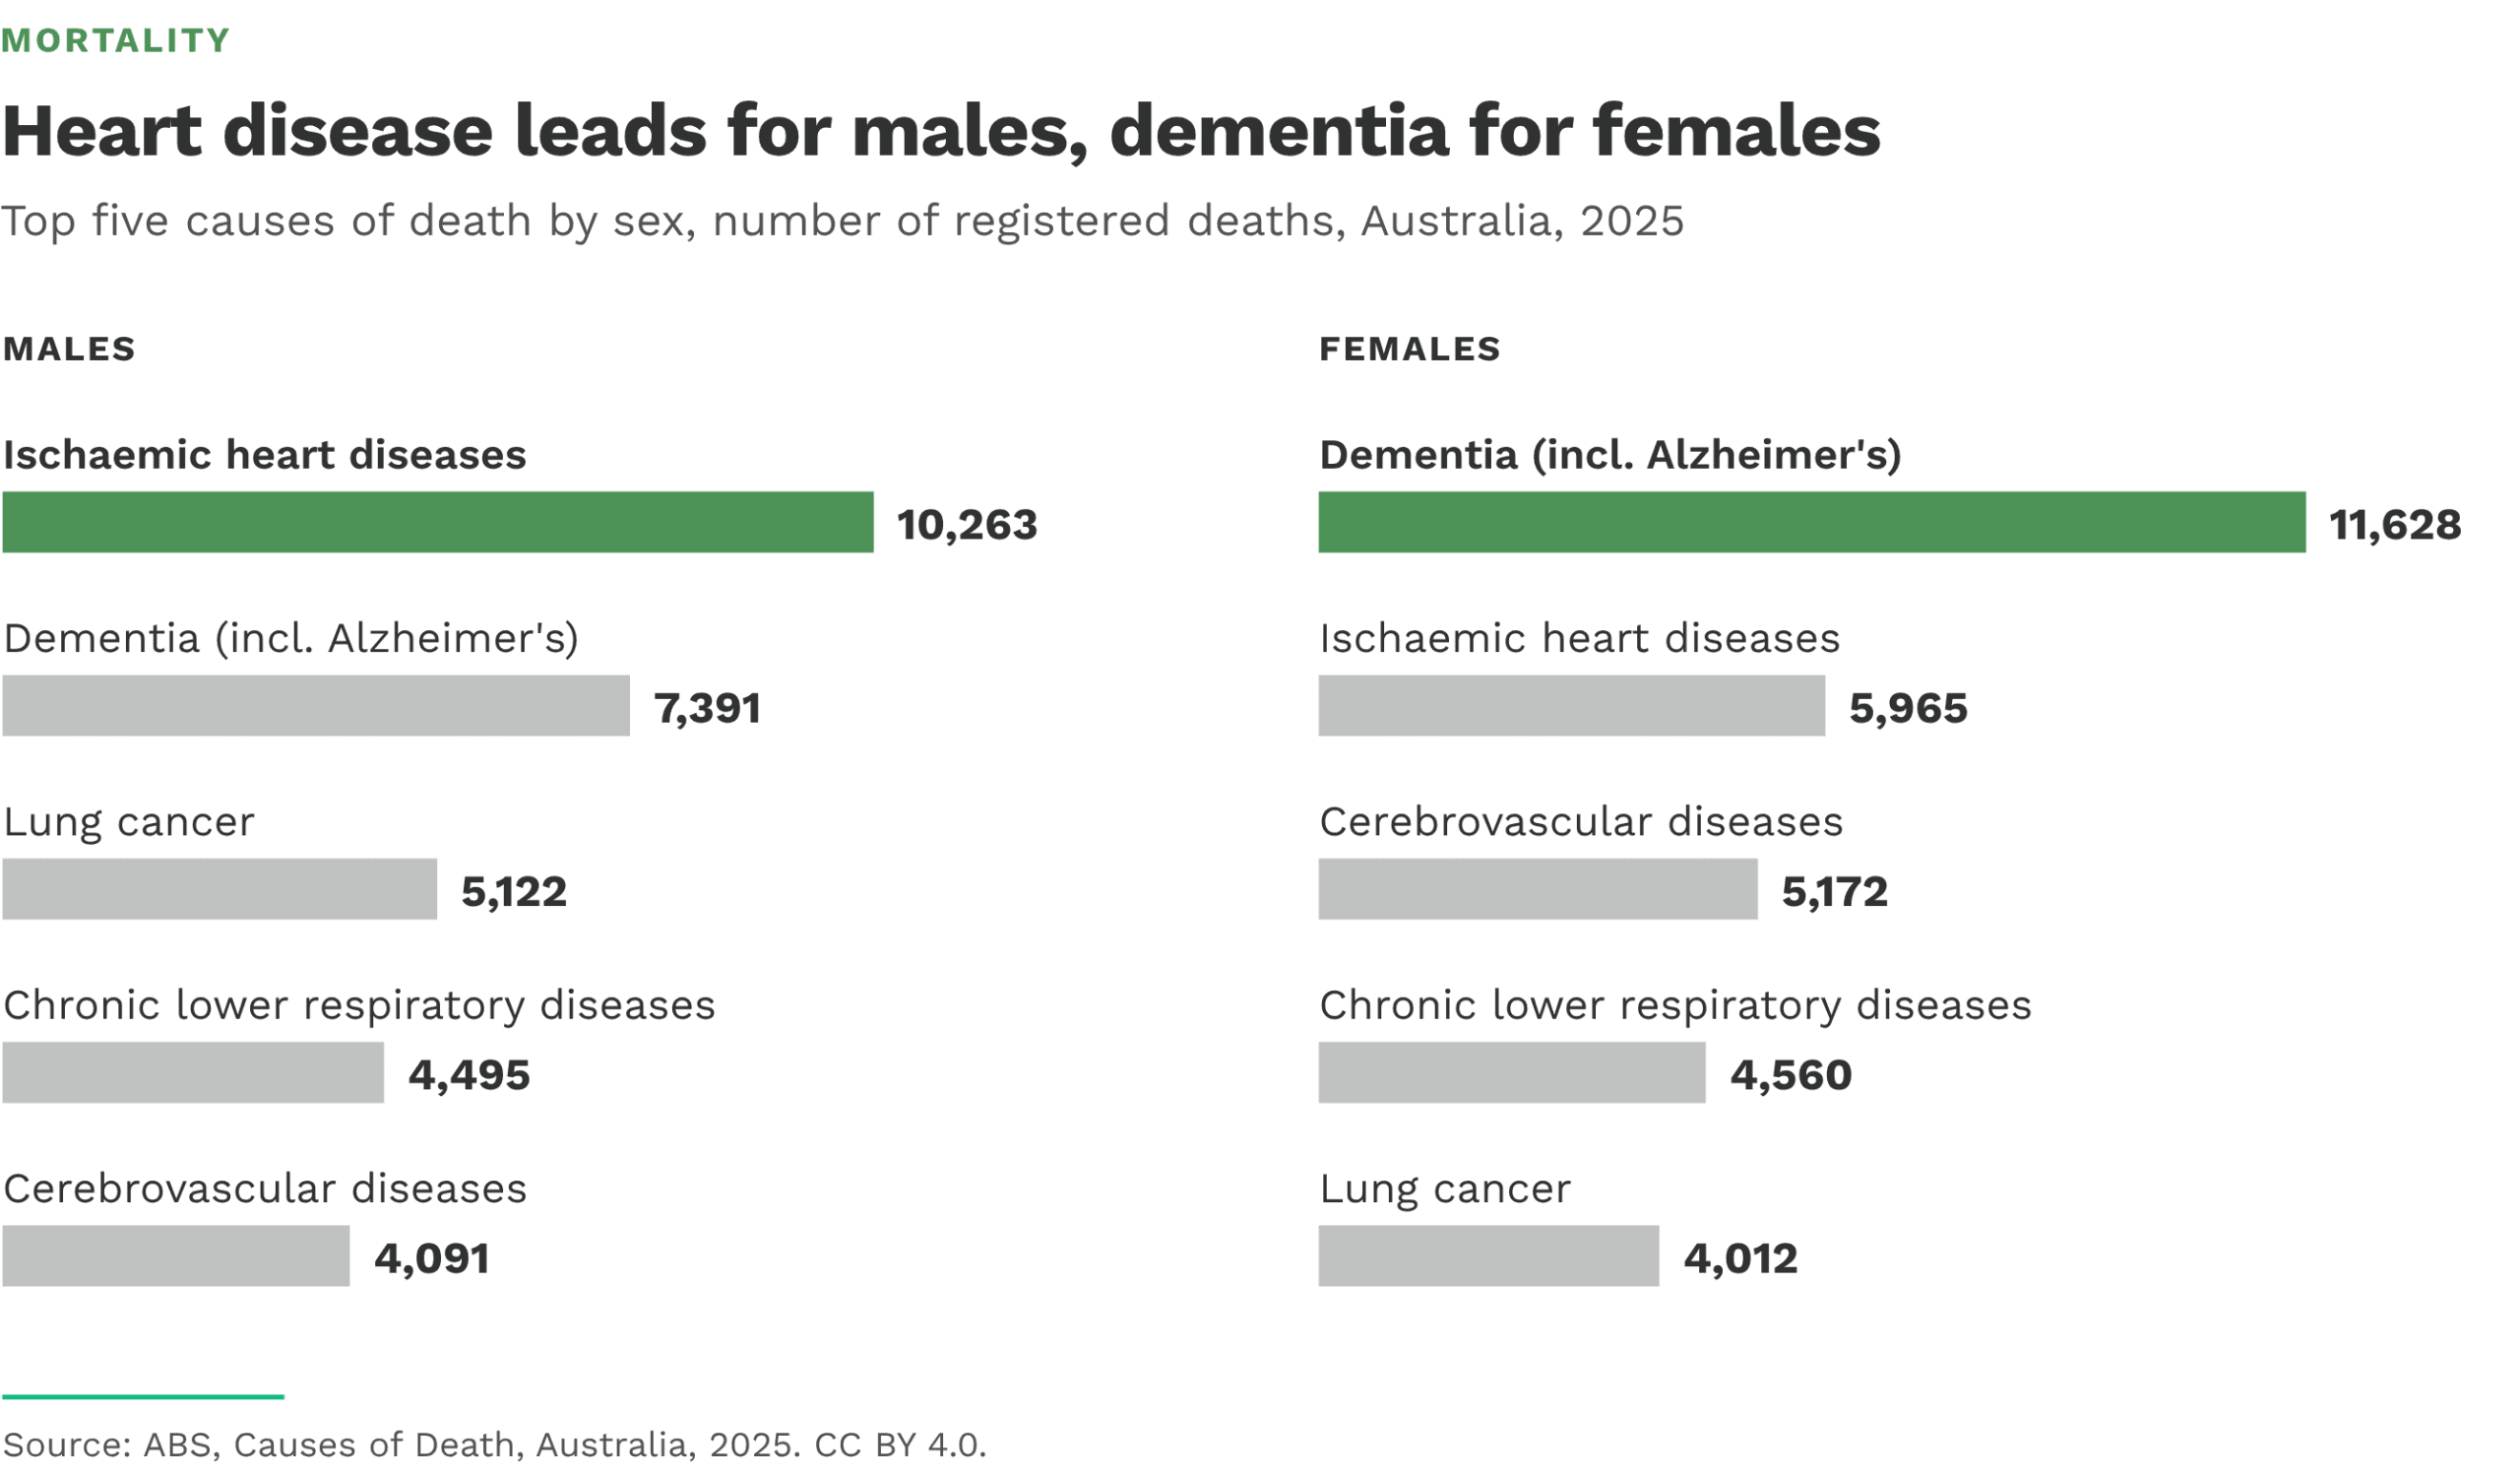
The ABS notes that across all Australians, dementia was the leading cause of death in 2025, accounting for 10.1% of all deaths, ahead of ischaemic heart diseases (8.6%).
2.2 Infant mortality – Infant mortality rate (1909–2025)
This line graph tracks Australia’s infant mortality rate over more than a century. The rate fell from 71.6 deaths per 1,000 live births in 1909 to 3.40 in 2025, about 21 times lower. Most of this fall happened before 2000, and over the last ten years the rate has stayed between 3.1 and 3.4. The long-term decline reflects improvements in sanitation, nutrition, immunisation, pregnancy care and newborn medical care.
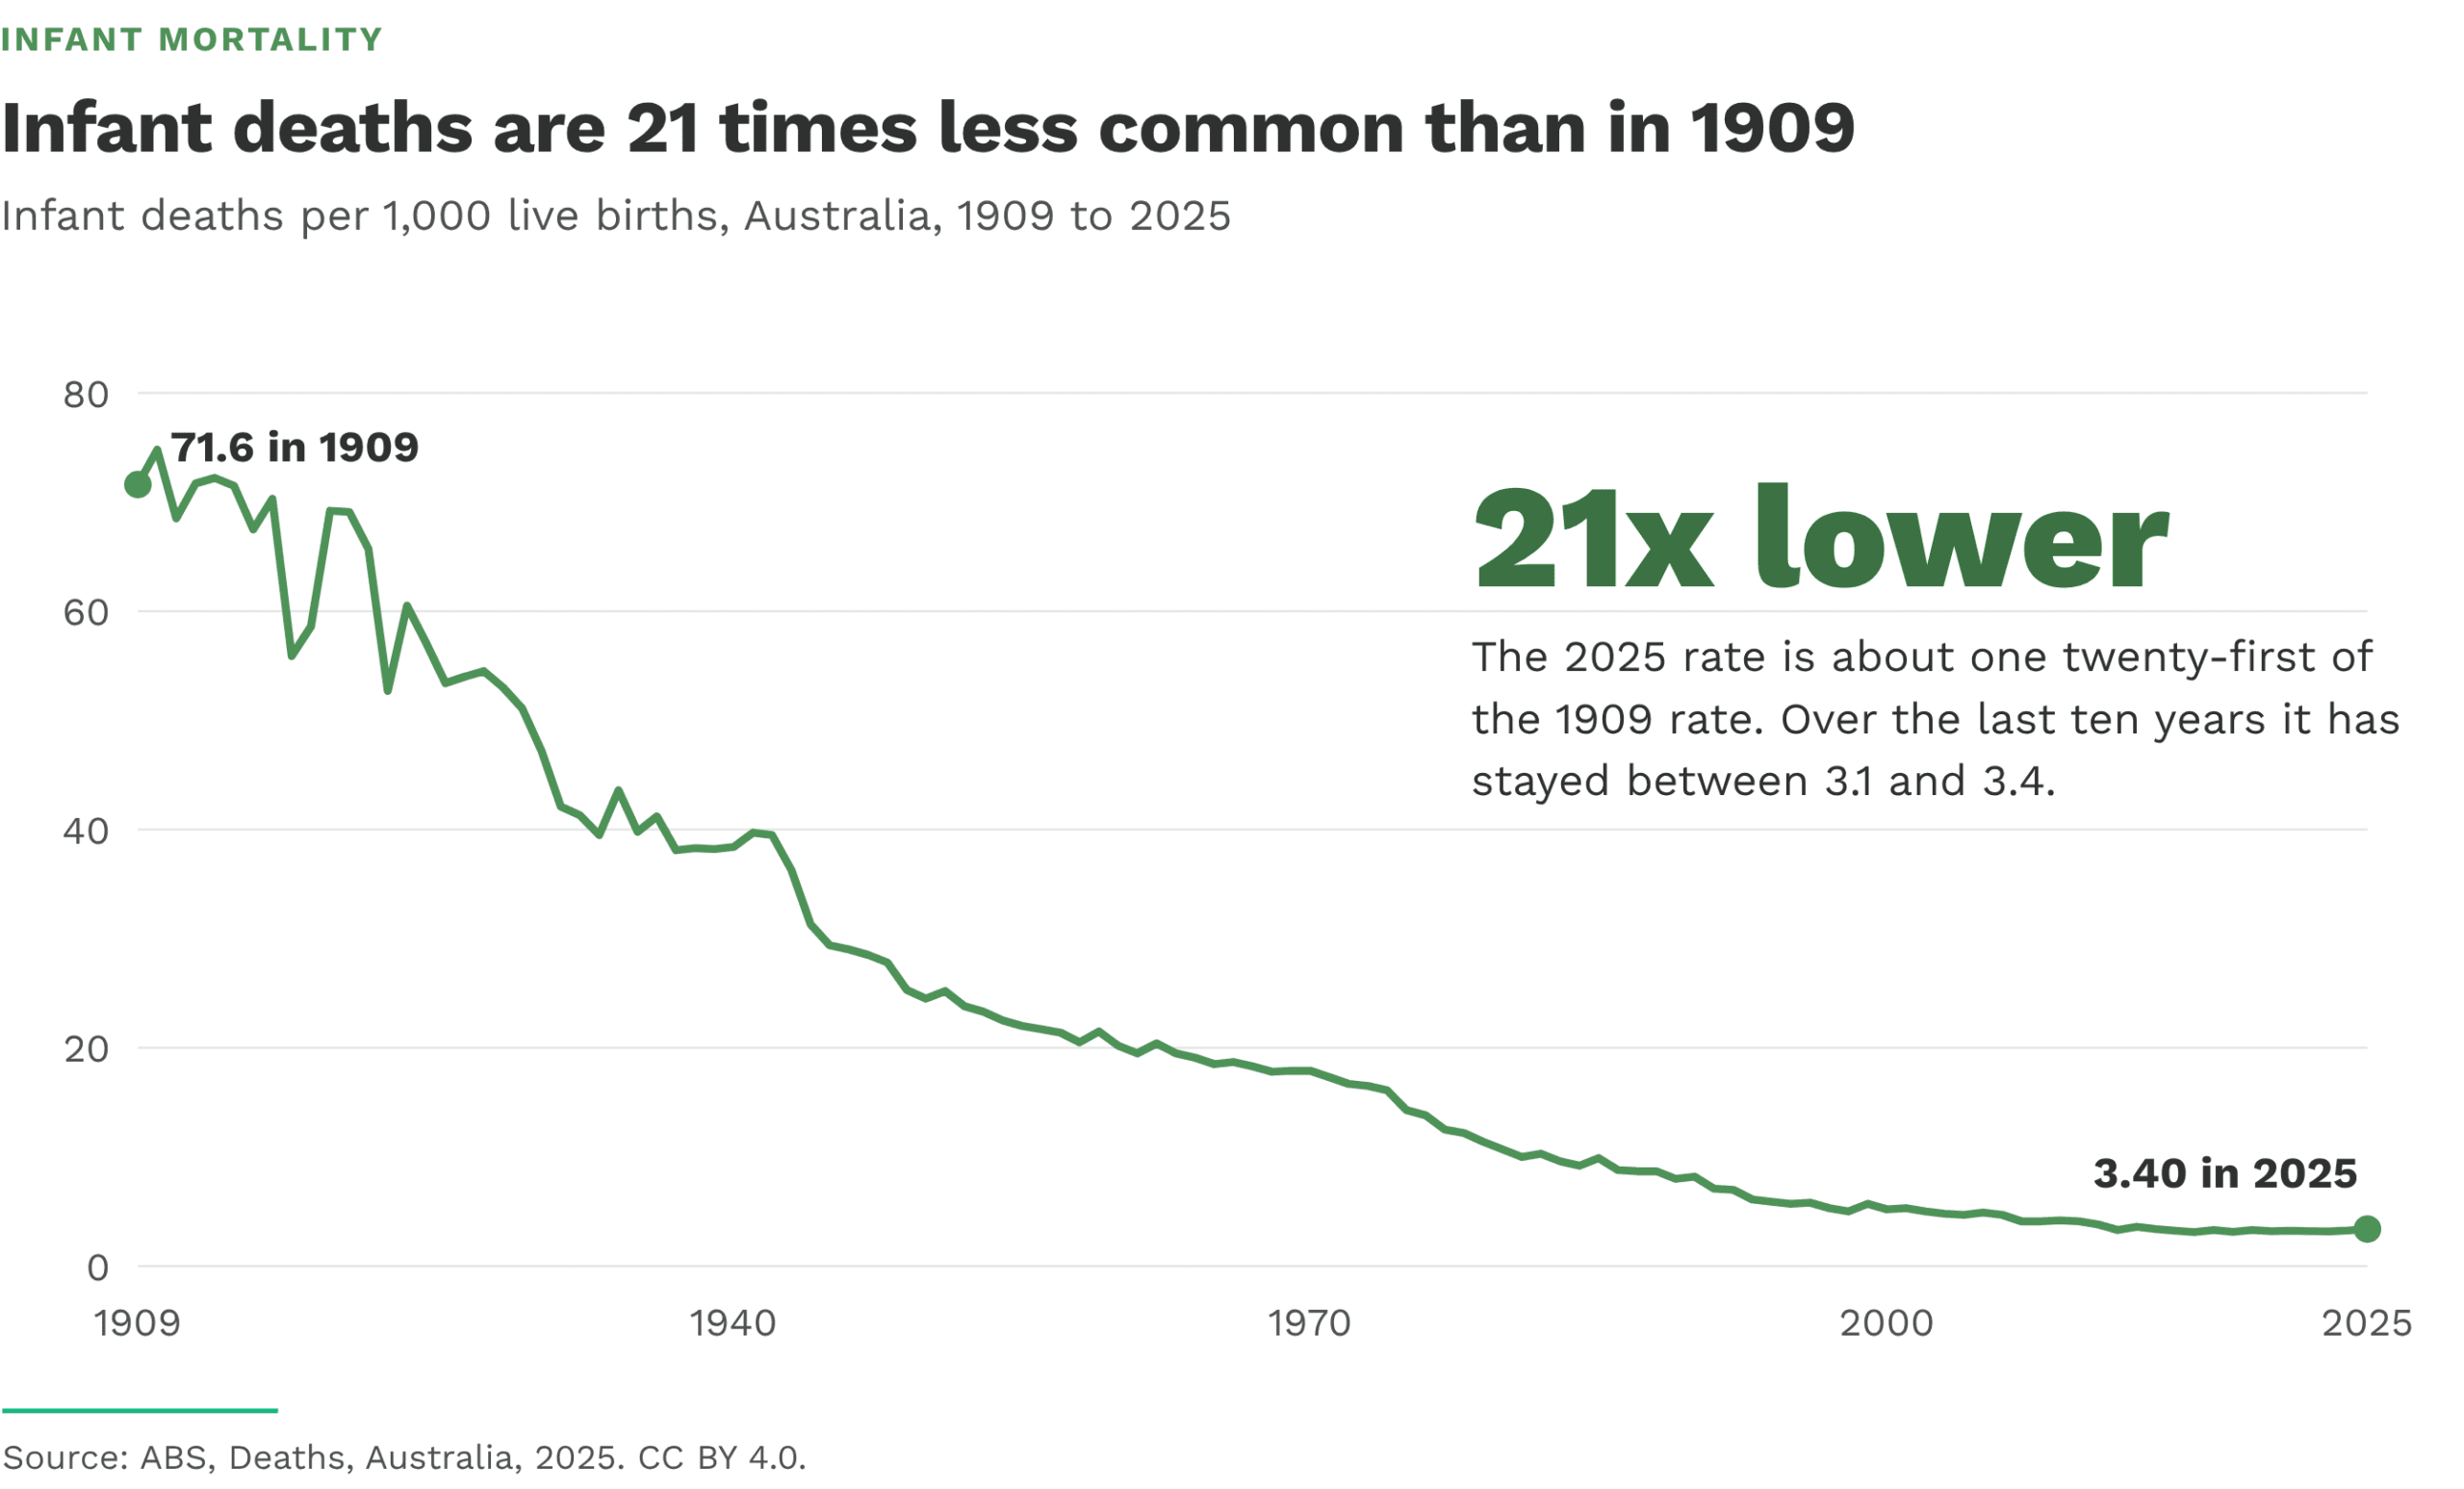
The ABS notes that Australia has one of the lowest infant mortality rates in the world. There were 1,019 infant deaths registered in 2025 (568 boys and 451 girls).
2.3 Morbidity – Hospitalisation rates for chronic conditions (2012–13 to 2021–22)
This chart displays hospitalisation rates for chronic conditions across nine financial years. It illustrates that hospitalisations increased through the decade, reaching their highest point in 2018–19, before declining slightly in the following years. The lowest rate occurs in 2012–13. The visual underscores how chronic conditions place a substantial and growing demand on hospital services, and it helps identify when healthcare utilisation pressures were most acute.

According to the AIHW’s Chronic conditions data insights, the figure shows that between 2012–13 and 2021–22 the hospitalisation rate for chronic conditions peaked in 2018–19 and was lowest in 2012–13
2.4 Incidence – New cases of type 2 diabetes (2021)
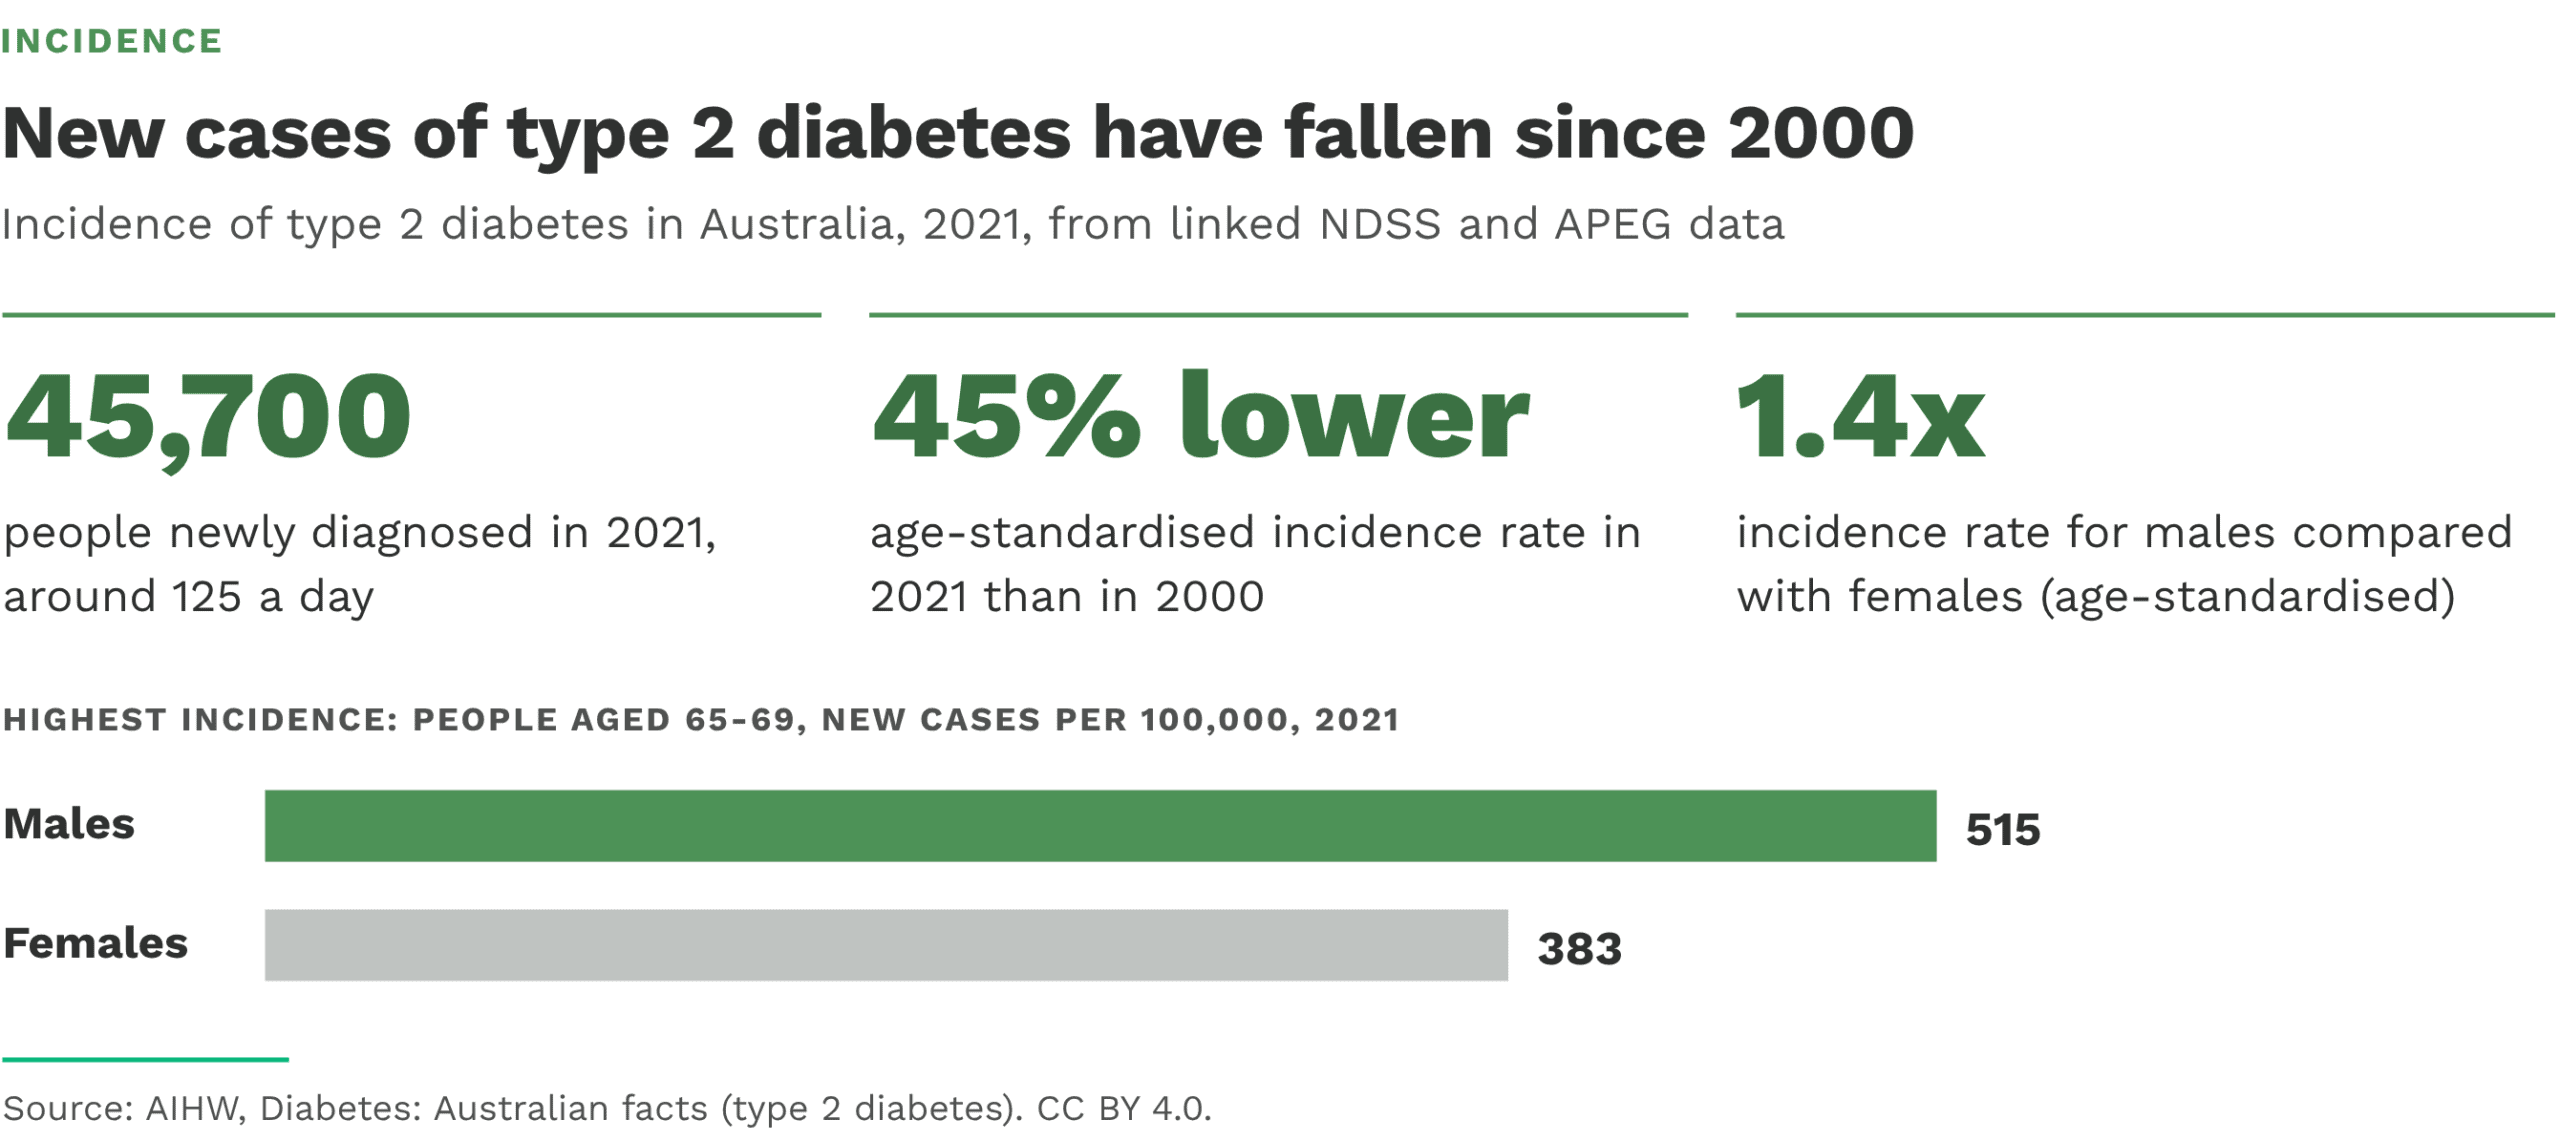
This figure summarises the incidence of type 2 diabetes. Around 45,700 people were newly diagnosed in 2021, about 125 people a day. The age-standardised incidence rate fell by 45% between 2000 and 2021. New cases were most common among people aged 65–69 (515 per 100,000 males and 383 per 100,000 females), and males were 1.4 times as likely as females to be newly diagnosed. The AIHW suggests the fall may be due to improved prevention, screening and awareness.
Incidence figures are based on linked National Diabetes Services Scheme (NDSS) and Australasian Paediatric Endocrine Group (APEG) data.
2.5 Prevalence – Proportion of adults with type 2 diabetes (2001–2022)
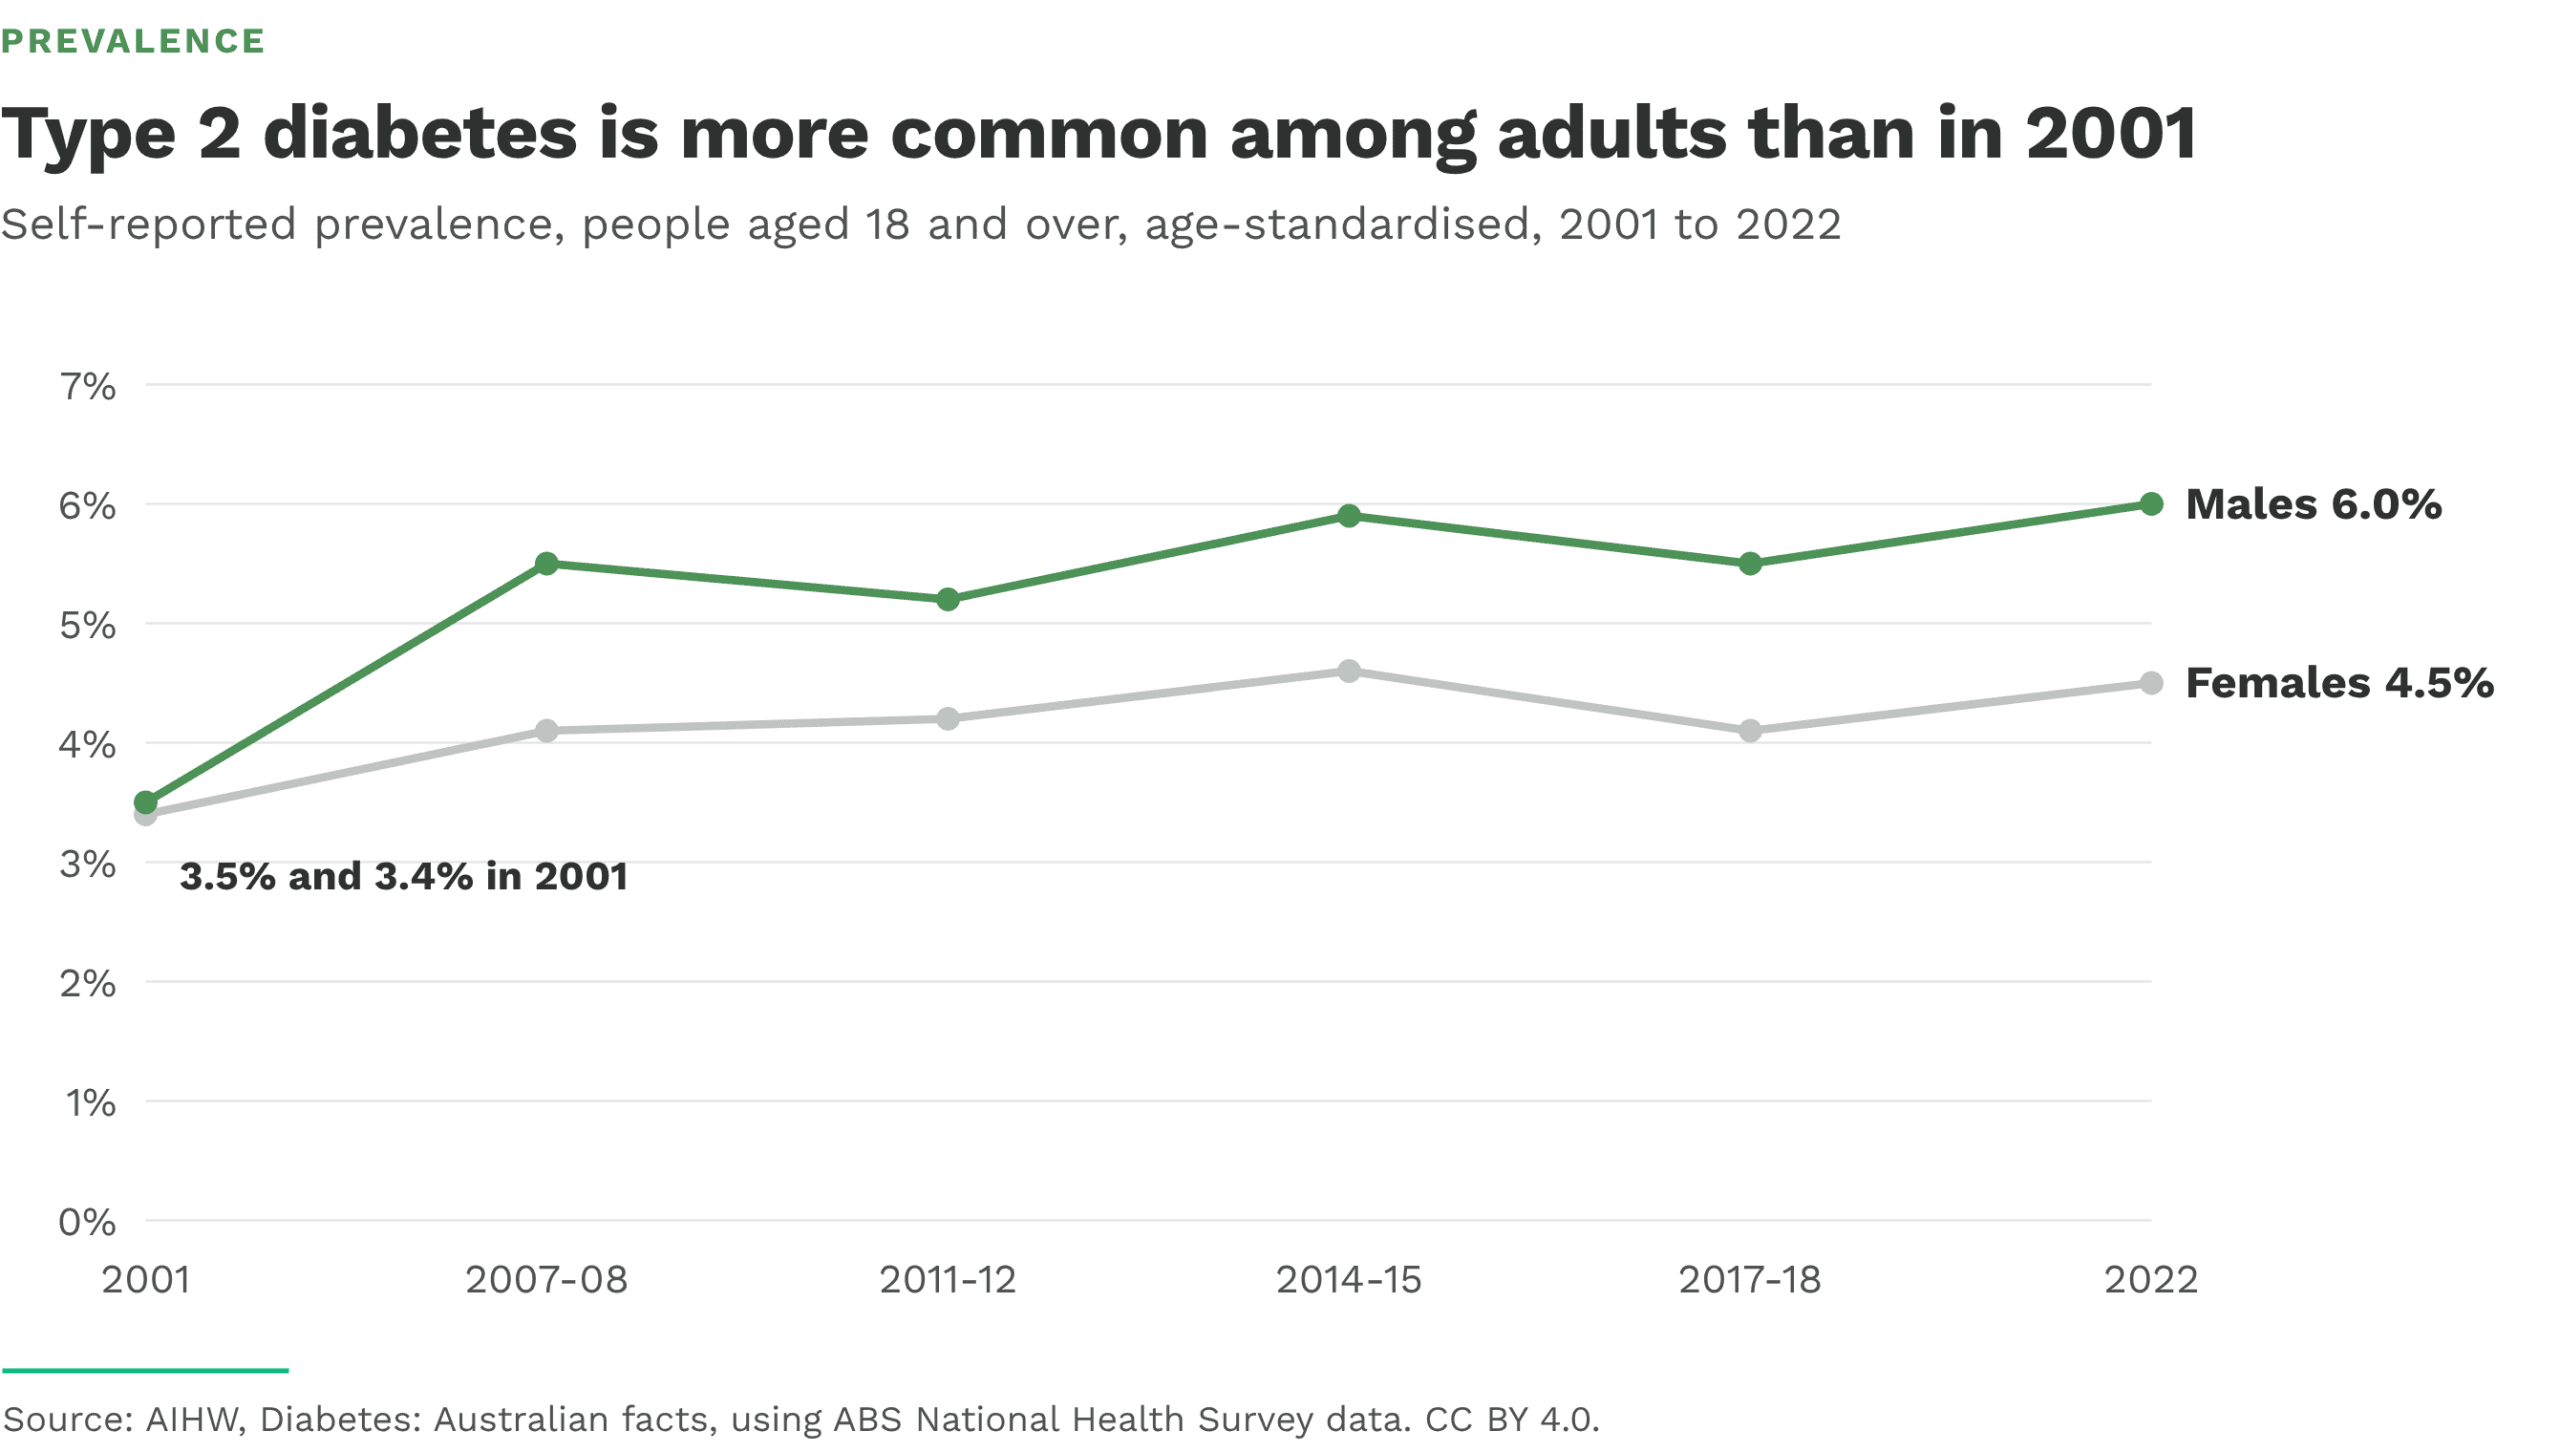
This line graph shows the self-reported prevalence of type 2 diabetes among people aged 18 and over (age-standardised) from 2001 to 2022. Prevalence rose for both sexes, from 3.5% to 6.0% for males and from 3.4% to 4.5% for females. Using registration data, the AIHW reports that almost 1.2 million Australians (4.6%) were living with type 2 diabetes in 2021, and that prevalence rises steeply with age, peaking at ages 80–84 (22% of males and 17% of females). Because people live with type 2 diabetes for many years, prevalence can rise even while incidence falls.
Based on self-reported ABS National Health Survey data, age-standardised to the 2001 Australian Standard Population.
Prevalence – Proportion of people with type 2 diabetes by location (2018)
Figure CC.10 visualises how the prevalence of type 2 diabetes varies across Australia. The map plots age‑standardised rate ratios by Population Health Area, so each area’s rate is compared with the national average after adjusting for differences in age structure. The highest prevalence ratios in 2018 were observed in Barkly/Tenant Creek and Elsey/Gulf/Victoria River in the Northern Territory, and Molonglo in the ACT. This indicates that these locations have substantially higher prevalence than the national average, whereas many other areas fall around or below the average.

The AIHW’s Australia’s health 2024: data insights – The ongoing challenge of chronic conditions in Australia notes that Figure CC.10 (“Prevalence of type 2 diabetes varies considerably by location”) shows age‑standardised rate ratios for type 2 diabetes prevalence by Population Health Area (people aged 18 and over, 2018). It comments that the highest rate ratios occurred in Barkly/Tenant Creek (NT), Elsey/Gulf/Victoria River (NT) and Molonglo (ACT), and reminds readers that rate ratios compare each area with the national average adjusted for age
3. Strengths and limitations of epidemiology
Epidemiology is useful because it:
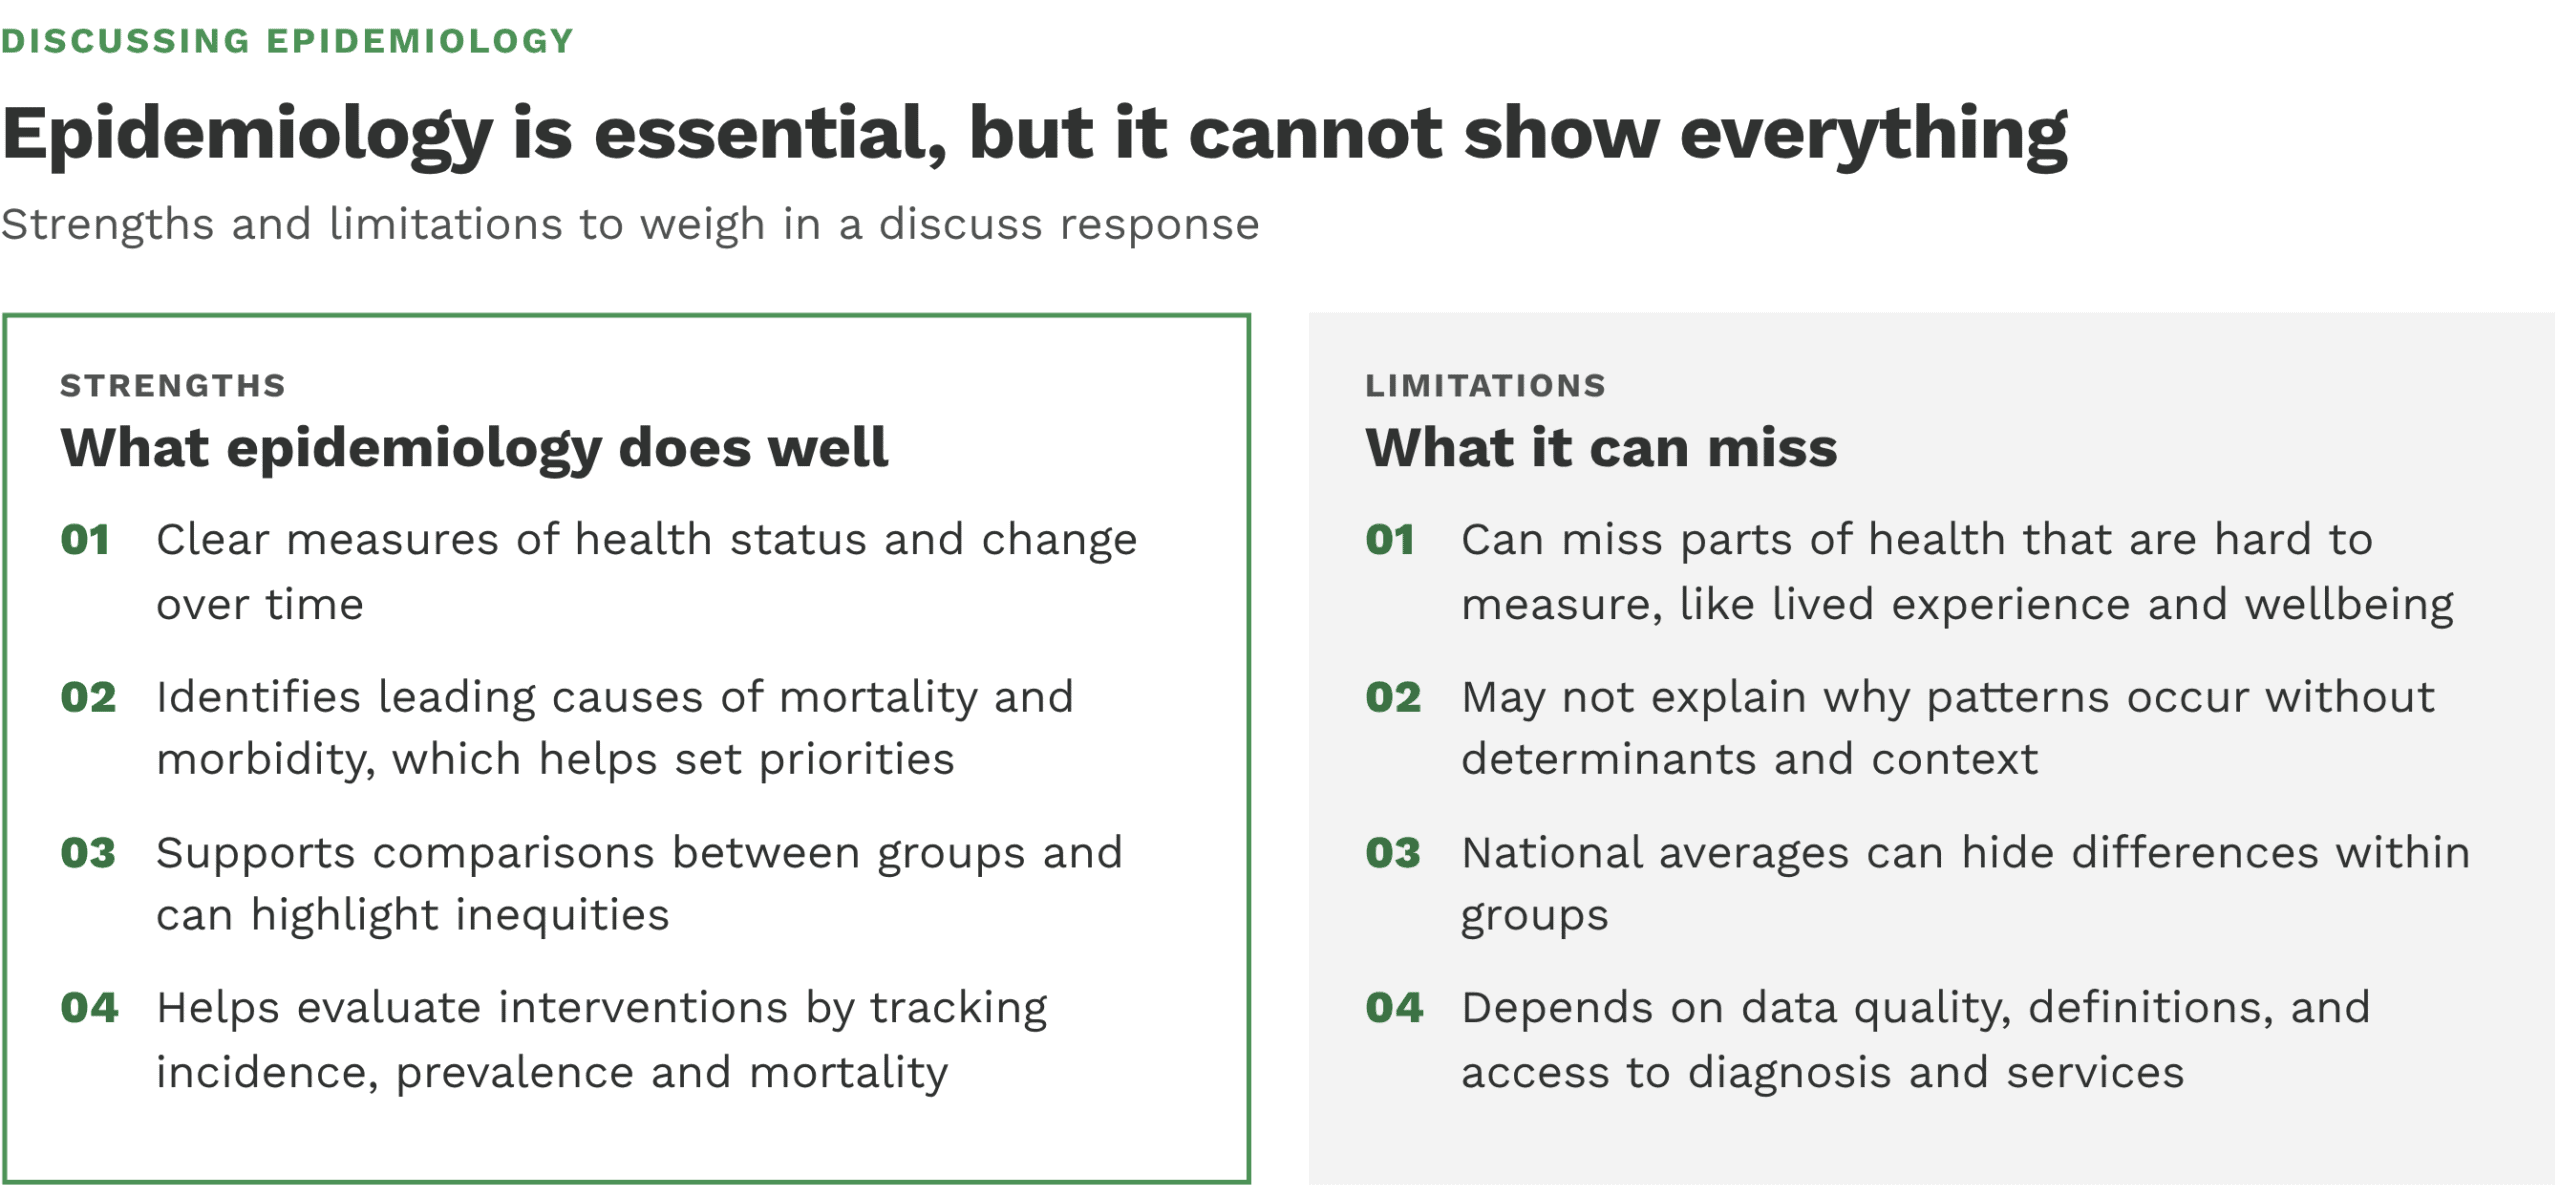
- provides clear measures of health status and change over time
- identifies leading causes of mortality and morbidity, which helps set priorities
- supports comparisons between groups and can highlight inequities
- helps evaluate interventions by tracking changes in incidence, prevalence, and mortality
Epidemiology has limits because it:
- can miss parts of health that are harder to measure (like lived experience and wellbeing)
- may not fully explain why patterns occur without also looking at determinants and context
- can hide differences within groups when only national averages are reported
- depends on data quality, definitions, and access to diagnosis and services, which can affect rates
Overall, epidemiology is essential for explaining the health status of Australians, but it works best when tables and graphs are read carefully and interpreted alongside context and determinants.
Brief Summary
About the dot point and how to approach it
- Epidemiology uses population data to show patterns and causes of health and disease using measures such as mortality, infant mortality, morbidity, incidence and prevalence.
- Discuss requires more than one relevant point, including strengths and limitations, supported by evidence from tables and graphs.
1. Epidemiology
- Epidemiology is the study of health and disease in populations, looking for patterns and causes, and measuring how often events occur.
- Measures used to explain health status: mortality, infant mortality, morbidity, incidence, prevalence (and life expectancy).
2. Using tables and graphs to explain health status
- Interpret by identifying the measure, unit, population, and whether results are crude or age-standardised.
- Trends can reflect real change or changes in diagnosis, reporting, access to care, or population structure, and data notes can affect reported incidence and prevalence.
- Key patterns shown: non‑communicable diseases dominate leading causes of death, infant mortality is low and mostly declining, chronic conditions account for most disease burden, and cancer incidence can rise while mortality falls.
3. Strengths and limitations of epidemiology
- Strengths: clear measures over time, identifies leading causes of mortality and morbidity, supports comparisons between groups and highlights inequities, evaluates interventions using incidence, prevalence and mortality.
- Limitations: can miss lived experience and wellbeing, may not explain why patterns occur without determinants and context, and averages can hide differences within groups.